


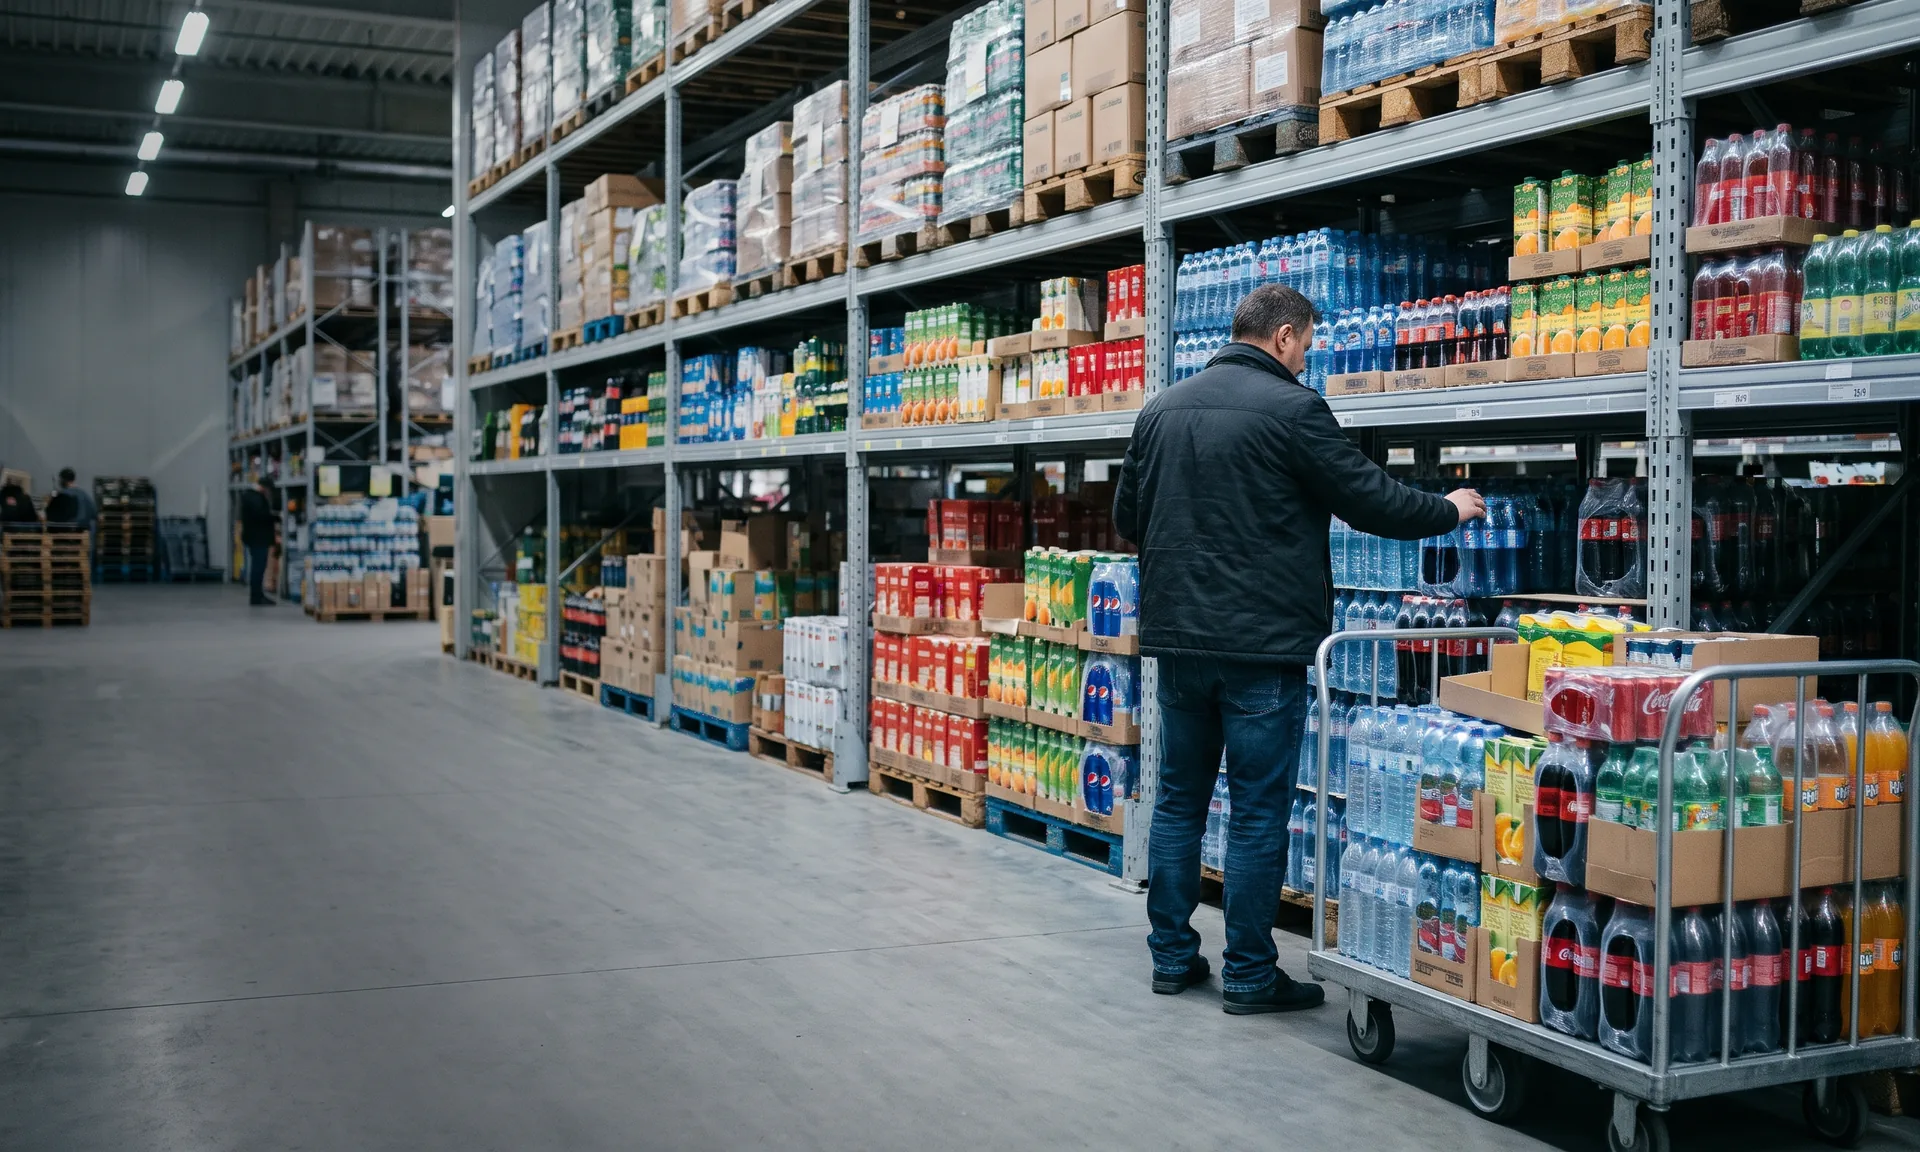
Category share data, store by store, from your distributors
Category share is your sales in a category divided by the store’s total purchases in that category from your distributors. Category Share Data is a module of Trade Data Hub, the Asseco Platform solution that collects your sell-out from distributors. It adds the category total for each store. You see your share in every store where the distributor shares category totals, including stores your reps never visit.
With the category total, you can see whether you have a large or a small part of what a store buys in the category.
The definition
What is category share data?
Your distributors already report what each store bought from you. With Category Share Data, they also report the store’s total purchases in the category: your products and competitors’ together, as one total for each store. You decide which products and suppliers make up the category. Your sales divided by that total give your category share. No new field work is needed.
Your own sell-out and Category Share Data, side by side
| TodayYour own sell-outWhat your distributors report about your products |  Category Share Data | |
|---|---|---|
| What you get | Your sales in each store | Your sales, the category total and your share in each store |
| Which stores | Stores that buy your products | Every store that buys products in the category from distributors that share category totals, including stores that buy nothing from you |
| Competitors | Not visible | One total per category in each store |
Same sales, different share
Two stores with the same sales and a very different share
Store A and Store B each buy EUR 900 a month of your products from the same distributor. Neither gets a rep visit, and on the distributor’s report they look the same.
In Store A the category is large and your share is small. In Store B you already have most of the category. The category total shows the difference.
| Store A | Store B | |
|---|---|---|
| Your sales per month | EUR 900 | EUR 900 |
| Category total per month | EUR 9,800 | EUR 1,400 |
| Your category share | 9% | 64% |
| Rep visits | None | None |
Shelf and sales
What category share data adds to your shelf audits
A shelf audit counts facings (the product fronts facing the shopper) on the day a rep visits. Category share data comes from what distributors deliver, so it reflects what stores buy.
Stores you never audit
Category data comes from distributors, not from visits, so it also covers stores outside your visit plan.
Shelf space and purchases can differ
Your share of the shelf can be higher than your share of what the store buys.
A falling share between audits
When the category grows and your sales stay flat, your share falls. Category data shows this between audits.
Example: an audit shows your products hold 40% of the shelf in a store. Category data shows they make up 11% of the store’s category purchases. In comparable stores where your products have a similar share of the shelf, your category share averages 28%. So the store has your products on the shelf and buys less of them than comparable stores do.
How it works
From your distributors’ data to your share in every store
First data on category share is typically available within two weeks of signing the contract.
Category Share Data runs on the Trade Data Hub integration with your distributors. If your distributors are not connected yet, we start with that integration.
The categories
About an hour to agree your categories
Together with your team we set up the taxonomy, the structure of your categories, usually on four levels. For example: soft drinks › carbonated drinks › cola › sugar-free cola. Products are grouped by what the shopper chooses between, so a competitor’s product bought instead of yours is in the same group.
Then the products your distributors carry are assigned to these categories. A machine learning model assigns new products as they appear, and your team checks the ones it is not sure about.
The data
Your distributors add category totals
We send each distributor the list of products in each of your categories. The distributor returns the total sales of each category to each store, through the channels it already uses for Trade Data Hub. Wholesalers and cash-and-carry operators can both take part.
The matching
The same store as in your database
Each distributor names and codes stores in its own way. We link each record to one store in your database, as in the rest of Trade Data Hub. Products are linked to their manufacturer by barcode, using GS1 product data, so a supplier listed under different names by different distributors counts as one supplier. When several distributors supply one store, their deliveries are added up: each distributor sees only its own deliveries, and you see the combined category total from all distributors that share category totals.
The reports
Your share in every store
You see your share in OneView, the Asseco Platform reports built in Power BI.
In the reports
What you see in OneView
The data appears in OneView, with filters by area, store type, chain and period.
Your position in the category
Your sales, competitors’ sales as one total, and your share over time.
Headroom in each store
Your share is compared with the average share in a group of comparable stores. You choose the group, for example by store type or area. Headroom is the extra monthly sales the store would bring if your share reached that average, zero if it is already there.
Stores without rep visits
A list and a map of stores outside your visit plan, with your sales, the category total and the headroom in each.
Sales lost to a falling share
Where your share is lower than a year ago: what you would have sold at last year’s share of this year’s category purchases, minus what you sold. For example: last year your share was 20%. This year the store’s category purchases are EUR 10,000, and 20% of that is EUR 2,000. You sold EUR 1,500, so the lost sales are EUR 500.
Distribution gaps
Groups of stores that account for a large part of category purchases, where few of the stores buy your products. For example, one store chain or one store type in a region.
Illustrative data. Comparable stores: stores of a similar size in the region, with an average category share of 31%.
Your category share, last 12 months
Stores, sorted by headroom
| Store | Your sales | Category total | Share | Headroom | Rep visits |
|---|---|---|---|---|---|
| Convenience store, Oak Street | 900 | 9,800 | 9% | 2,138 | No |
| Minimarket, Lake Avenue | 0 | 4,300 | 0% | 1,333 | No |
| Grocery, Market Square | 1,250 | 6,100 | 20% | 641 | Yes |
| Grocery, Hill Street | 610 | 3,200 | 19% | 382 | No |
| Corner kiosk, Station Road | 900 | 1,400 | 64% | 0 | No |
| Petrol station shop, Ring Road | 2,050 | 5,900 | 35% | 0 | Yes |
EUR per month.
In use
Running in 13 categories
Category Share Data runs in 25 live deployments (November 2026), in these categories:
- Beer
- Spirits
- Soft drinks and juices
- Functional drinks
- Coffee
- Confectionery and biscuits
- Savoury snacks
- Sauces
- Canned and frozen vegetables
- Crispbread
- Tobacco products
- Over-the-counter (OTC) medicines and supplements
- Decorative paints
An example
Among the stores with the highest category purchases:
Illustrative
Use cases
Use category share data in other solutions
Other Asseco Platform solutions can use your category share for each store in your database. You buy Category Share Data separately, and none of these solutions is required.
Store segmentation
Store segmentation can use your share as one of its criteria. It compares your share in a store with stores of the same format, location and main reason people shop there.
Explore store segmentation →Route-to-Market Optimization
When you assess the potential of stores and areas, or decide which new stores to serve, Route-to-Market Optimization can use your share.
Explore Route-to-Market Optimization →Sales & Retail Execution
When you plan rep visits and tasks, you can see the store’s category share.
Explore Sales & Retail Execution →Data rules
Competitors appear only as category totals
Category data includes competitors’ products, so these rules apply.
- Totals only. Distributors never send competitors’ sales by product. You receive one category total for each store.
- A minimum number of suppliers. A category total is requested only when the category includes products from a minimum number of other suppliers, agreed with you and your legal team.
- Product lists, not sales. To build your categories, you see which products your distributors carry, including competitors’ products. You do not see their sales by product.
- The distributor decides. Each distributor decides whether to share category totals and does so under contract.
About category share data
What is category share?
Your share of the total purchases in a category. In Category Share Data, it is your sales to a store divided by the store’s total purchases in the category from your distributors.
What if a store also buys products in the category elsewhere, for example from a wholesaler that does not share totals or directly from a manufacturer?
Those purchases are not in the category total. Your share covers the store’s purchases from distributors that share category totals.
How is it different from retail panel data such as Nielsen?
A retail panel such as Nielsen estimates market sales from a sample of stores. Category Share Data comes from your distributors’ sell-out data and shows your share in each store they deliver to. The figures differ because the denominator is different: a panel gives your market share, Category Share Data gives your category share in each store. If you already buy Nielsen data, Trade Data Hub can load it as well, so you see both side by side.
Data and competitors
Can I see competitors’ sales by product?
No. You see which competitor products your distributors carry, so that they can be assigned to your categories. For sales, distributors send one category total for each store.
Which distributors can provide category data?
Wholesalers and cash-and-carry operators connected to Trade Data Hub, or connected to it as the first step of the project, that agree under contract to return category totals for each store.
Getting started
Do I need Route-to-Market Optimization to use it?
No. Category Share Data is bought separately. It needs a working Trade Data Hub integration with your distributors.
How long until the first data is available?
Agreeing the category taxonomy takes a session of about an hour. First data on category share is typically available within two weeks of signing the contract.
Check whether your distributors can share category data
Tell us which distributors sell your products and which categories you compete in. We will check with you which of them already send your sell-out to Trade Data Hub and what is needed to add category totals.
Book a call
