






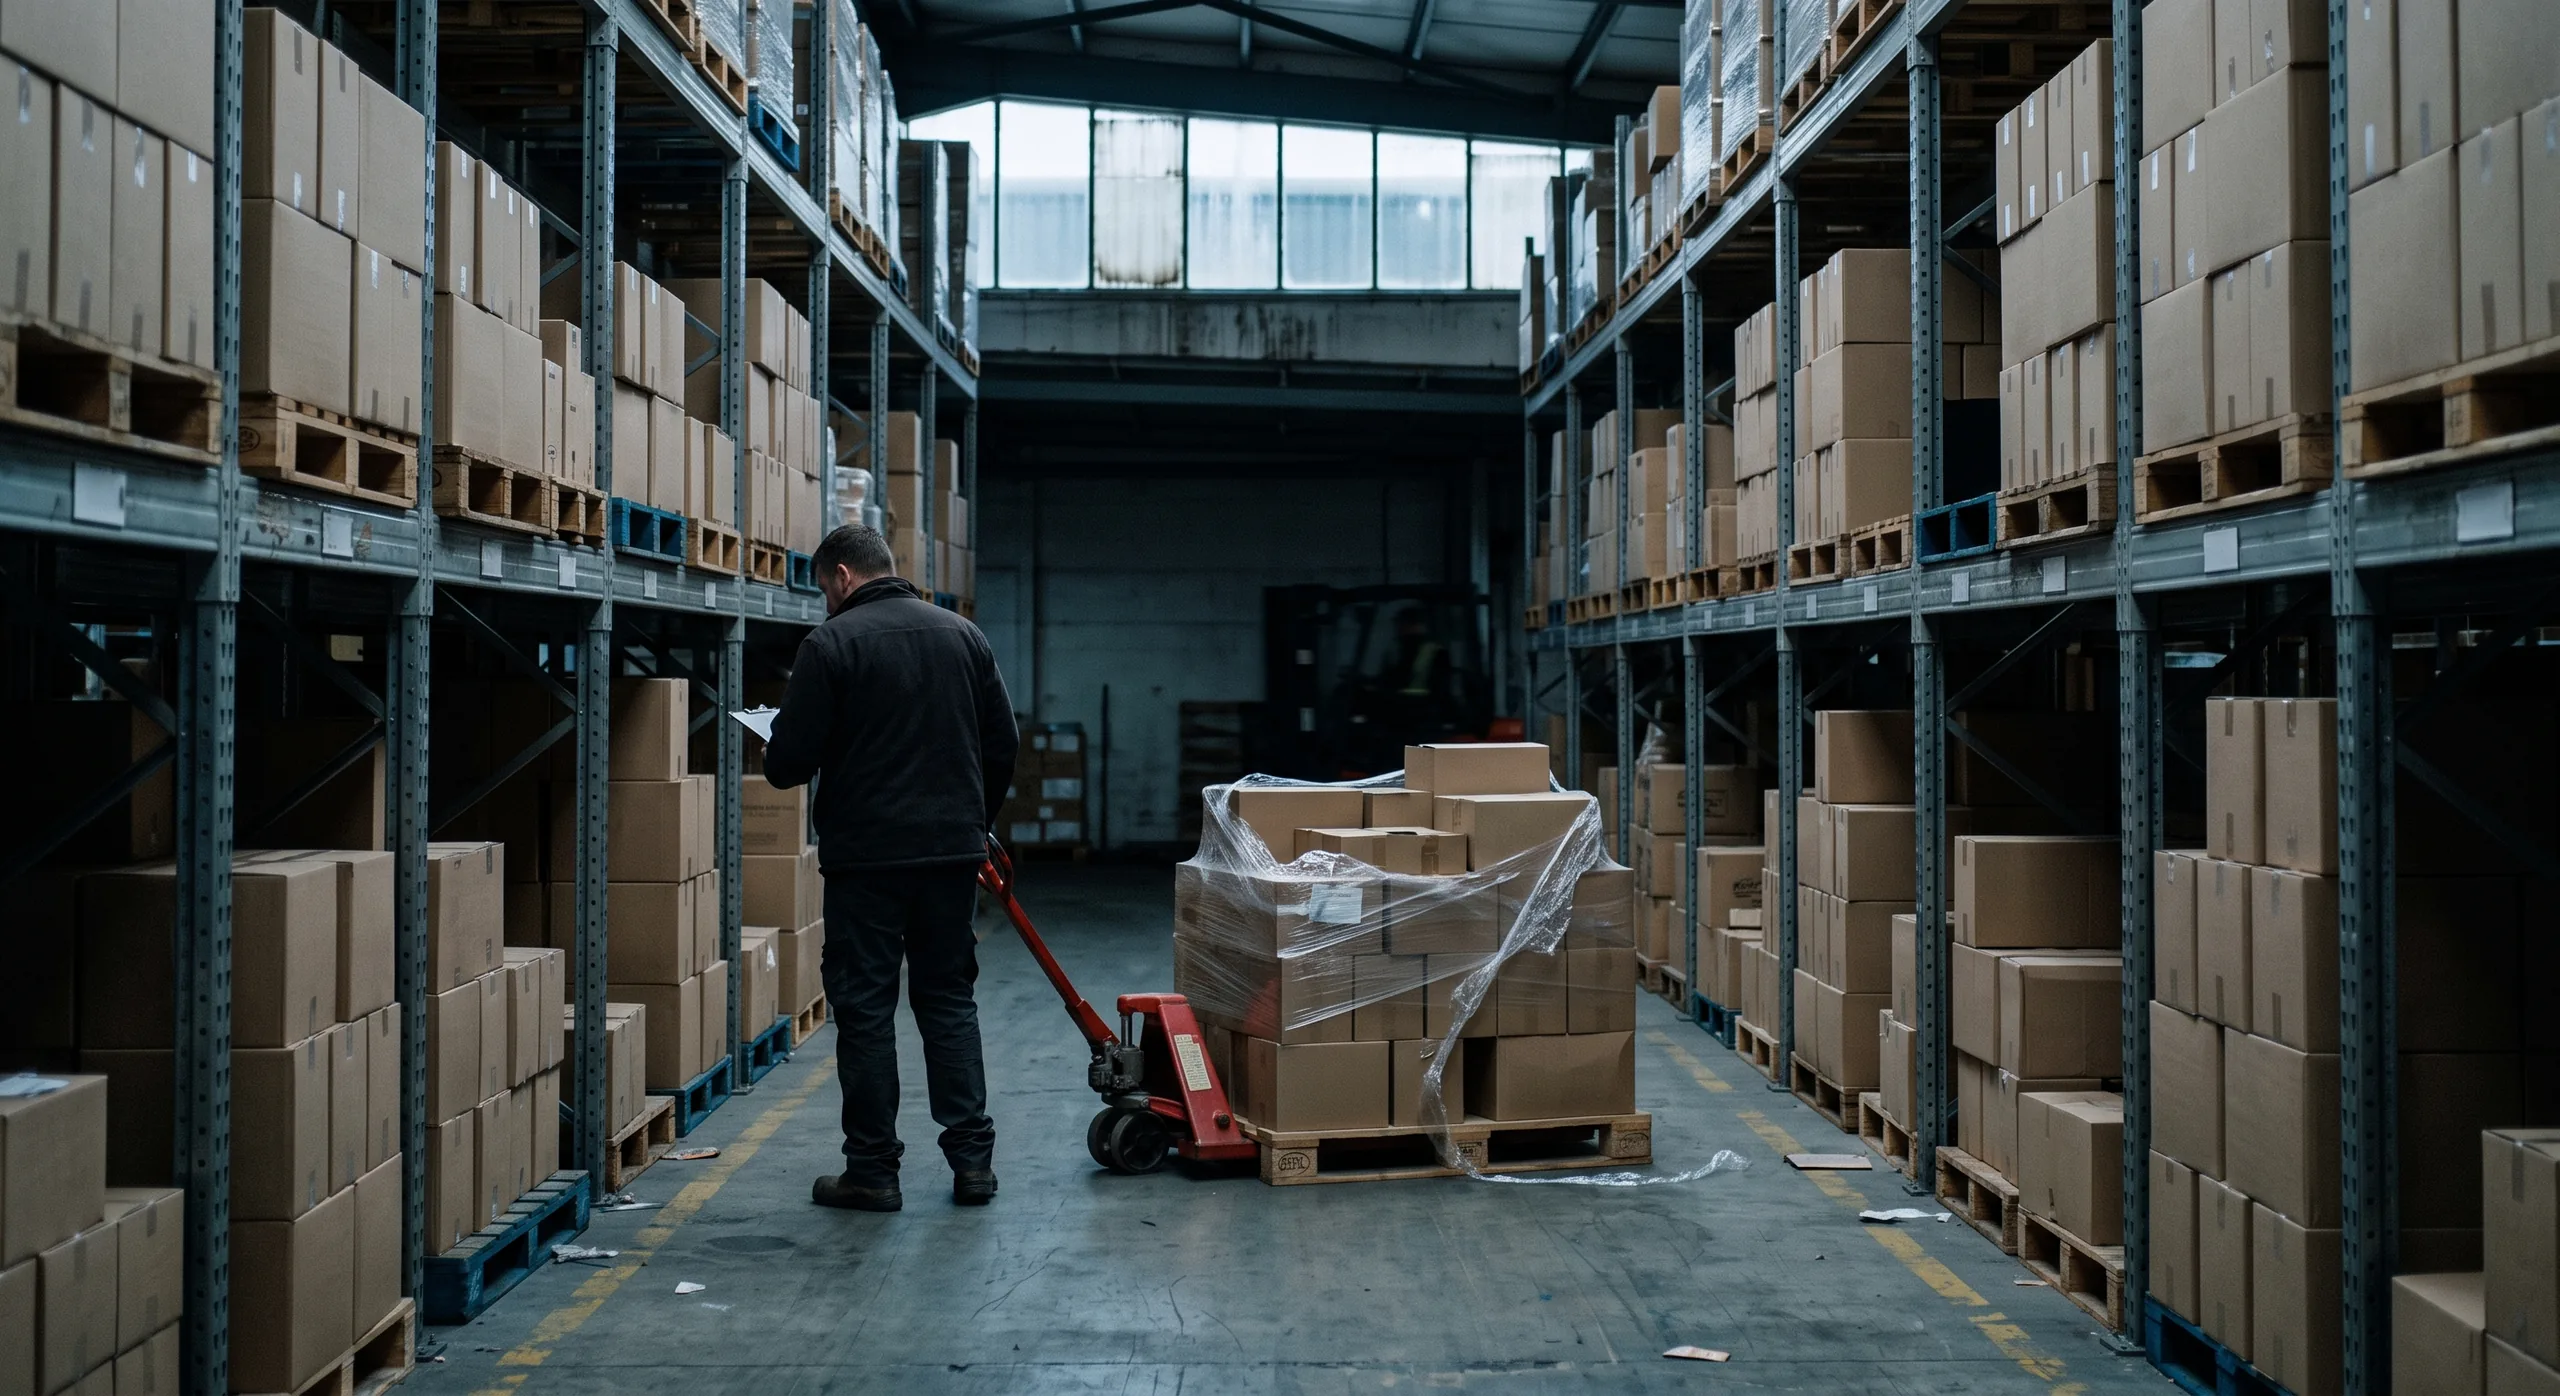
Your rep took the order. Did the distributor deliver it?
You see the orders your reps took and you see what the distributor invoiced. The gap between the two is everything the store never received.
OTIF compares the two, order by order and line by line. A delivery that came late, or came with less than the store ordered, stops reaching you as a phone call. It runs on the orders your field teams place and on the invoices your distributors issue.
Between the order and the invoice
Once the order goes to the distributor, the next thing you see is a sales number
Your rep visits a store, takes the order and sends it to the distributor who serves that store. From that moment somebody else decides what happens to it. The distributor puts the shipment together, decides what goes out now and what waits for the next delivery round, and sends the goods.
Three things follow, and none of them show up in your reports.
A delivery that arrives incomplete looks exactly like weak demand. The store ordered twelve cases and the distributor sent seven. Those five cases never sell. The distributor’s sell-out data shows a product that moves slowly, and the next order is smaller. The store was not choosing a competitor. It had nothing on the shelf to sell.
A delivery that arrives late leaves no trace in a monthly total. An order that took nine days instead of two and a half still falls inside the same month, so the month looks normal. The store sold its remaining stock in two days and then stood empty for a week, in the middle of a promotion you paid for.
And nobody can point to where the problem sits. Ask which distributor runs late, or which of its depots is short on a given category, and the answer comes from whoever complained loudest. Your commercial team knows deliveries are a problem. They cannot show which distributor, which store or which week.
How it works
Every order compared with what the distributor actually invoiced
On-Time In-Full (OTIF) works on two sets of documents you already have. The orders your reps place, and the sales documents the distributor issues when the goods leave its warehouse. Linking the two is what the measurement depends on, and it is configured during implementation, together with the connection to each distributor.
The order
Recorded when it is agreed
Your rep places the order in the store, with the customer in front of them. Products, quantities, the date. The order can come from Mobile Touch, our own field execution solution, or from whatever your teams already use. OTIF needs the order data, whatever holds it.
The delivery
The distributor’s own sales documents
Trade Data Hub connects the systems of the distributors you sell through and brings their invoices back in your own product and customer codes. Each document is matched to the order it fulfilled.
The comparison
Ordered against delivered, at two levels
Ordered against delivered: which lines came complete, which came short, how many days passed before the order was closed. You decide whether one short line fails the whole order or counts only against that line. Both levels ship as separate reports on the same data, and a third one drops the completeness test to show simply how much of the order arrived.
The result
Back to the person who took the order
Your rep sees which of their own orders arrived short, and at which store. In Mobile Touch that view is built in.
What gets measured
Complete, on time, and where it breaks
In Full
Whether the order arrived complete. It can be counted on whole orders, where one short line fails the whole order, or line by line, where only that line fails. The same delivery gives two different percentages, so both are worth keeping, and each can run on quantity or on value. A third reading drops the completeness test: it simply divides delivered by ordered, so 80 cases out of 100 count as 80% instead of nothing.
On Time
How many days pass from the order to a complete delivery, and how those days are spread. An average of three days made of half same-day and half week-long deliveries is a different problem from an average of three days where everything takes three.
Where it breaks
Ranked lists that show where the shortfall sits: distributors with no complete order at all, products that never arrive whole, and the reps whose orders suffer most. Each list is sorted so the biggest shortfalls come first.
In Full and On Time break down the same way: by distributor down to the branch, by your own sales structure down to the rep who took the order, and by category down to the individual product. The third view is built differently, as ranked lists.
Three of the five branches sit below the 83.4% In-Full rate for all orders, and the table says which.
Orders delivered in full, last 12 months
15,406 delivered in full
3,066 short on at least one line
In-Full trend, last six months
By distributor, down to the branch
| Distributor | Branch | Orders | In full | In-Full rate | vs prev. |
|---|---|---|---|---|---|
| Distributor A | North | 3,180 | 3,021 | 95.0% +1.4 | |
| Distributor A | Central | 2,940 | 2,675 | 91.0% +0.6 | |
| Distributor B | South | 2,610 | 2,166 | 83.0% −0.9 | |
| Distributor C | East | 2,105 | 1,494 | 71.0% −3.2 | |
| Distributor C | West | 1,870 | 1,421 | 76.0% −1.1 |
Half the orders close within two days. The tail after day seven is what pulls the average up.
Orders closed on day
Average days by distributor
| Distributor | Avg days | |
|---|---|---|
| Distributor A | 1.8 | |
| Distributor D | 2.1 | |
| Distributor B | 2.6 | |
| Distributor E | 3.4 | |
| Distributor C | 5.9 |
Distributor C sits at 5.9 days while the network averages 2.8, so almost the whole tail after day seven is one partner.
Ranked lists that show where the shortfall concentrates, biggest first.
Distributors with no complete order
Products with no order delivered in full
Reps whose orders suffer most
Largest gaps between ordered and delivered
| Product | Category | Ordered | Delivered | Short | Delivered vs ordered |
|---|---|---|---|---|---|
| 1.5 L carbonated, 6-pack | Soft drinks | 8,400 | 6,460 | 1,940 | 76.9% |
| 0.25 L energy, 24-pack | Energy | 5,200 | 4,080 | 1,120 | 78.5% |
| Promotional multipack | Soft drinks | 3,600 | 2,730 | 870 | 75.8% |
| 0.5 L still water, 12-pack | Water | 6,900 | 6,540 | 360 | 94.8% |
The promotional multipack is short in the month the promotion ran. Without this list it later reads as a promotion that did not work.
Who reads it
One measurement, four readings
Ordered against delivered answers a different question for a sales director, a distributor manager, supply chain and a regional manager. The first three read it in OneView, the fourth on a phone in the field.
Every distributor in one list, weakest In-Full at the top.
Distributors ranked by In-Full, weakest first
| Distributor | Markets | In-Full | Avg days | Agreed level | |
|---|---|---|---|---|---|
| Distributor C | 2 | 73.5% | 5.9 | below | |
| Distributor G | 1 | 78.0% | 4.2 | below | |
| Distributor B | 3 | 83.0% | 2.6 | below | |
| Distributor D | 2 | 92.4% | 2.1 | met | |
| Distributor A | 4 | 95.0% | 1.8 | met |
The last column says whether the partner met the level its agreement sets.
A single distributor, expanded to branch and category.
By category
| Category | In-Full | |
|---|---|---|
| Soft drinks | 64% | |
| Energy | 71% | |
| Water | 88% | |
| Juices | 94% |
Lines that keep coming short
| Product | Months short | Avg shortfall |
|---|---|---|
| 1.5 L carbonated, 6-pack | 6 of 6 | 23% |
| 0.25 L energy, 24-pack | 5 of 6 | 21% |
| Promotional multipack | 4 of 6 | 24% |
| 1 L juice, 8-pack | 3 of 6 | 11% |
One line came short in every one of the last six months, and three more in at least half of them.
Where the same line comes short at several partners, the stock was usually not there on our side.
Same line, several distributors
| Product | Distributors short | Share of network | Likely cause |
|---|---|---|---|
| 1.5 L carbonated, 6-pack | 7 of 9 | our supply | |
| 0.25 L energy, 24-pack | 6 of 9 | our supply | |
| Promotional multipack | 4 of 9 | mixed | |
| 0.5 L still water, 12-pack | 1 of 9 | this partner |
A line short at seven partners at once points at our own stock. A line short at one partner points at that partner.
The region, down to the sales rep whose stores keep getting incomplete deliveries.
By territory
| Territory | Orders | In-Full | |
|---|---|---|---|
| Territory 14 | 640 | 72% | |
| Territory 9 | 580 | 79% | |
| Territory 22 | 510 | 84% | |
| Territory 5 | 690 | 93% |
A store that keeps getting part of its order stops ordering. You lose the outlet first and the revenue later.
From measurement to agreement
A delivery standard you can write into the terms
When both sides accept the same In-Full figure, a distributor agreement can hold more than volume targets. Once In-Full is measured the same way every month, from the distributor’s own documents, the agreement can set a level for it and pay a bonus when the level is met.
The agreed level sits in the contract next to volume targets and promotional conditions, and Trade Terms & Settlement settles all three the same way. The In-Full figure in OneView shows whether the level was met, and the settlement engine calculates the bonus that follows.
A partner below the level opens the same view and sees, line by line, which orders came short.
The agreed level, the In-Full the documents showed, and the bonus that follows. Figures for the closed quarter.
Agreed level against what the documents showed
| Distributor | Agreed level | In-Full measured | Avg days | Outcome | |
|---|---|---|---|---|---|
| Distributor A | 90% | 95.0% | 1.8 | bonus due | |
| Distributor D | 90% | 92.4% | 2.1 | bonus due | |
| Distributor F | 85% | 88.1% | 2.4 | bonus due | |
| Distributor B | 90% | 83.0% | 2.6 | below level | |
| Distributor C | 90% | 73.5% | 5.9 | below level |
Every row is calculated from the distributor’s own sales documents, so neither side has to accept the other’s spreadsheet.
What one agreement looks like
Measured In-Full against the agreed level
Where the numbers come from
Measured at two global manufacturers, in beverages and in consumer health
Both sell through distributors and wholesalers across several markets, and both had the same gap before the measurement started. Orders left the app the reps use, goods left the distributor’s warehouse, and nobody could say how much of what was ordered actually arrived.
What changed first was the conversation with the partner. A monthly review that used to be an exchange of impressions became a reading of the same figures on both sides, taken from documents the distributor issued. In-Full deliveries reached up to 95%. Days to a complete delivery came down by half, from five to two and a half.
Questions
OTIF in FMCG distribution
What is OTIF?
OTIF stands for On-Time In-Full. It measures whether an order was delivered by the agreed date and in the full quantity ordered. In FMCG distribution it is read on the orders a manufacturer’s reps place with distributors and wholesalers, against the sales documents those distributors issue when the goods ship. An order that arrives complete but late fails OTIF. So does one that arrives on the day, short by two cases.
How is OTIF calculated?
Divide the number of orders that were delivered both on time and complete by the total number of orders in the period. Two decisions change the result more than the formula does. One is the level you count on: the whole order, where one short line fails the whole order, or the individual line, where only that line fails. A line delivered in part counts as nothing on that level, so 90% of the quantity is worth the same as zero. The same delivery therefore gives two different percentages, and both are worth keeping. The other decision is where the clock starts and stops. That has to be one date convention for every distributor, or the comparison between them means nothing.
What is a good OTIF level?
It depends on the channel and on what the agreement says, so your own trend is the benchmark worth watching. In our deployments with FMCG manufacturers, In-Full delivery reached up to 95% once the measurement was running and the results were discussed with distributors every month. The level matters less than knowing which partner, which branch and which product sits under the average.
What is the difference between OTIF and fill rate?
Fill rate is usually read proportionally: 80 cases delivered out of 100 ordered is 80%. In Full is binary, so the same delivery is simply not counted, so on the same data In Full never comes out higher than fill rate, and every missing case pulls the two further apart. OTIF adds timing on top, and a full delivery that came late does not count either. Read both and the two causes separate: missing stock pulls the proportional figure down, while a late truck leaves it intact and fails OTIF.
What do you need in place before OTIF can be measured?
You need two things: orders recorded at the moment they are agreed, and the distributor’s sales documents coming back to you. Linking the two is set up during implementation, so each invoice can be read against the order it covers. Manufacturers already running Trade Data Hub have the documents arriving, so only the order side is left.
Working together
Start with the distributors you already argue with
Nobody measures every partner from day one. The first cut is deliberately narrow, because the point of it is to see whether the number tells you something you did not already know.
Proof of concept
One distributor, one region
You pick the partner. We link their sales documents to your orders and measure a quarter backwards, so you read the first result on day one instead of waiting three months for it.
First deployment
The partners that carry the volume
The distributors who move the most volume, and the categories where a week out of stock is expensive. This is usually where a delivery target first goes into an agreement.
Full roll-out
The whole distribution network
Every partner on the same definition of complete and the same date convention, so the quarterly review runs off a ranking instead of single disputes.
How far the number moves depends on what happens after the monthly review. The manufacturers who reached 95% In-Full put the result on the agenda of every distributor meeting and kept it there.
See it on your own orders
Tell us which distributors you work with and how your orders reach them. We will show you what an OTIF measurement returns on a setup like yours.
Book a demo