






Is your planogram actually on the shelf in every store?
In most franchise networks nobody knows, because the shelf keeps moving and none of it reaches your data.
A photo answers it in seconds, and whoever is already in the store can take it. Planogram compliance means the shelf in the store matches the planogram your category team published. Retail Image Recognition reads it from a photo: missing products, prices away from the recommended one, and products standing where something else belongs.
The gap
The planogram is published. After that it drifts, and your data does not show it.
Your category team designs the range and publishes a planogram for it. Your commercial team sells a supplier the space that planogram defines. Then it goes out to hundreds or thousands of stores, each run by an independent owner with a full day of work ahead of them.
The first thing that goes wrong is easy to miss. The planogram lives in a system the store has no reason to open, so the owner often does not know what was agreed for their store this quarter: the obligatory products, the display sold to a supplier, the price the range should carry.
The second is that a shelf does not stay as it was set. It starts moving the day it is built, as stock runs out and as somebody rebuilds a block around whatever came in on the delivery. An area manager looks at a few stores, but that visit is one moment in one store, and the shelf has moved on since.
The third is that none of it reaches the data you work from. You can see what sold and what each store ordered. You cannot see what was standing on the shelf. So a product that sells nothing looks like a product nobody wants, when it may simply not have been there. The next order is smaller, and the gap turns permanent.
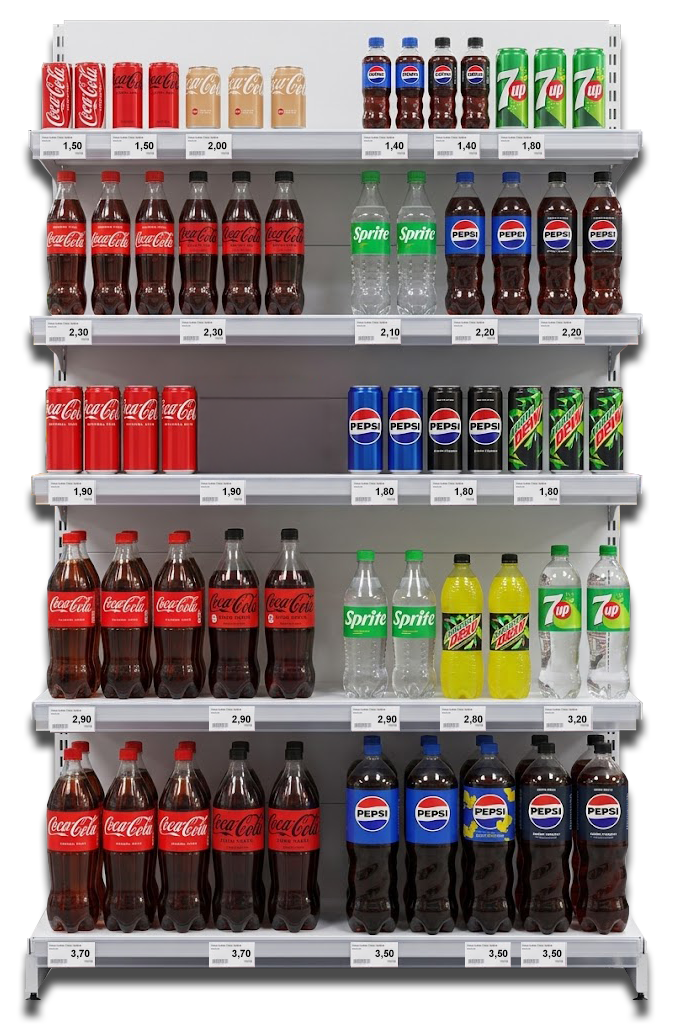
So the questions that decide your commercial year get answered from memory. Did the promotion go up on time in the stores the supplier paid for. Is the recommended price on the label this week, or a different one, and in how many stores.
How it works
From a photo of the shelf to a list of what to fix
Retail Image Recognition compares the shelf in front of the camera with the planogram you published. A check is one task on a phone, and the person running it needs no expertise in the category. Capturing the shelves in one store takes 2 to 5 minutes of the visit, where a manual round takes 15 to 20.
The task is waiting on their phone
Named for what it covers, Soft drinks, main aisle or Water, chilled, with a due date. The first step asks whether the location is ready. The second shows the planogram that applies here, and only then asks for the photo.
Shelf recognition reads the photo and sends the result back
It identifies the products, reads the printed prices and compares every position with the planogram in force for that store, that category and that segment of the shelf.
Cola regular 0.5 L bottle
The list of what to fix comes back on the spot
Each item is tied to a store, a category and a date. Nobody has to remember the planogram to correct the shelf against it.
What gets measured
Availability, price, planogram. One vocabulary in every store.
MissingThe products that have to be there
Obligatory listings, the launch you agreed with a supplier last month. The check shows which of them are absent from the shelf, store by store.
The price on the label
Printed prices are read from the photo and compared with the recommended price for that product. Where the label says something else, the gap comes back as a number.
Every position against the planogram
The arrangement on the shelf against the planogram in force, position by position: a product standing where a different one belongs, a line given less space than the planogram sets.
You do not have to measure all three. Availability, price and planogram are switched on category by category, so a franchise network that only wants to know what is missing measures availability and nothing else. Whatever you choose comes back worded the same way in every store, and that is what lets you compare one store with the next.
Who sees what
The same check answers a different question at every level
A network that routes every check through its own field team runs into arithmetic. The estate grows, the field team does not, and the number of visits per store per quarter falls. Shelf recognition breaks that link, because the check runs from inside the store. What comes back is one result per shelf, and five different jobs read it against five different questions.
Head office sees how closely each store and category follows the planogram, and which regions and categories are slipping.
Planogram match by region
Categories drifting fastest
| Category | Planogram | 4-week change |
|---|---|---|
| Soft drinks | 84% | −3.1 pts |
| Confectionery | 82% | −2.4 pts |
| Snacks | 88% | −1.2 pts |
| Dairy | 90% | +0.2 pts |
| Water | 92% | +0.6 pts |
A category buyer sees whether the range they designed is actually standing on the shelf, store by store.
Zero sales last week: no demand, or no product?
| Line | Stores with zero sales | Product on shelf | Product absent | Reading |
|---|---|---|---|---|
| 1.5 L cola | 148 | 31 | 117 | absence |
| 0.25 L energy | 96 | 62 | 34 | mixed |
| 1.5 L iced tea | 71 | 66 | 5 | demand |
| 0.5 L water | 54 | 51 | 3 | demand |
Range present, by category
An area manager sees their stores ranked on availability, price and planogram, weakest first.
Stores ranked by planogram match
| Store | Availability | Price | Planogram | Last check |
|---|---|---|---|---|
| Store 0417 | 89% | 86% | 71% | 2 days ago |
| Store 0233 | 92% | 90% | 76% | today |
| Store 0508 | 95% | 93% | 79% | 4 days ago |
| Store 0119 | 96% | 94% | 82% | today |
| Store 0342 | 97% | 96% | 84% | yesterday |
A field advisor sees what to fix in the store they are standing in, before they walk out of it.
Fix list from the last check
This store against the area
| Store | Area | |
|---|---|---|
| Availability | 89% | 94% |
| Price | 86% | 92% |
| Planogram | 71% | 89% |
A store owner sees their own shelf, on their own phone, before anybody comes to check it.
The list, not the theory. What to correct comes back position by position, on the shelf the owner has just photographed.
Re-check on the spot. Correct it, photograph it again, and the number moves the same day.
Of the five, the store owner is the only one already standing at the shelf. A store that gets its own three numbers back treats the check as its own rather than as an inspection.
The record
Every check leaves a dated record of what stood on the shelf
The compliance number tells you where the shelf stopped matching the plan. The photograph behind it tells you what was actually on it. Both stay in OneView after the shelf has been corrected, which is what turns a measurement into a record you can go back to.
That record changes one conversation in particular. A supplier who pays for a listing, a facing count or a promotional display is buying something that either stood in the stores or did not. Until there is a record, both sides argue it from memory and from whatever the field team happened to see. With one number per store and the photographs behind it, the same question has an answer that neither side has to take on trust.
How many stores kept a supplier-paid placement as agreed, with dated photos as proof.
Agreements against what the shelf showed
| What was agreed | Category | Stores | Delivered | Period |
|---|---|---|---|---|
| Secondary display, 4 weeks | Soft drinks | 420 | 91% | 09.06 – 07.07 |
| Chilled placement | Dairy | 380 | 94% | ongoing |
| Obligatory listing, 12 items | Snacks | 980 | 86% | ongoing |
| Extra facing, promoted line | Confectionery | 610 | 79% | 02.06 – 30.06 |
| End cap, 2 weeks | Water | 240 | 88% | 16.06 – 30.06 |
Evidence behind one line
1,412 dated photographs stand behind this one line.
Whether you use the record that way is your call. A network that only wants its own standard held gets exactly the same measurement, and nothing about it depends on settling anything with a supplier.
Customer story

Poland’s largest FMCG franchisor checks its shelves from photographs
Eurocash Group is the largest franchisor in Polish FMCG trade and an operator of independent store networks in the country. It brings together around 14,000 outlets under the brands ABC, Groszek, Euro Sklep (Moje Sklepy), Gama, Lewiatan, Delikatesy Centrum and Duży Ben. Its operations teams verify and enforce key store standards using objective data from shelf photographs.
“This is one of the most innovative IT deployments at Eurocash Group in recent years. Shelf image analysis lets us measure key KPIs automatically, and product recognition accuracy already reaches about 97% and keeps climbing. We also value the partnership approach of Asseco Platform, which made it possible to fit the solution properly to our business needs.”
Questions
Planogram compliance for franchise networks and buying groups
What is planogram compliance?
Planogram compliance is the degree to which the shelf in a store matches the planogram planned for it: the right products present, in the agreed order, with the agreed number of facings. In a franchise network, a symbol group or a retailer owned group, it is the measure of whether the standard agreed centrally survives in a store somebody else runs. Where a network also tracks the price on the label, the check reads the printed price against the recommended one for that product.
How do we check planogram compliance without visiting stores, and will store staff actually use it?
A photograph of the shelf, taken by whoever is in the store, is compared against the planogram in force there. The check is built for someone who has never seen the platform: photograph the shelf, read what is missing, fix it, photograph again. It runs on an inexpensive Android phone. The result comes back while that person is still standing at the shelf, and you read the same result in your reporting layer, per store and per category.
Is planogram compliance still useful if we already have a field audit team?
The visit stops being a counting exercise. Self-reported manual checks only reach the stores someone got to, and they describe the shelf as it was on the day of the visit. A photo check reads every shelf that was photographed, and anyone in the store can run it, the owner included. A network that keeps its field team changes what that team does with the hour it spends in the store.
Does planogram compliance work in a group owned by its members?
Yes, and the reason to measure is stronger there. In a retailer owned group, a buying group or a co-operative, the range and the planogram are ones your members agreed among themselves, and your central organisation answers to them. You cannot instruct a member, but you negotiated the terms on their behalf, so you have to be able to show that what was agreed reached their shelves. Without one way of measuring it, that conversation happens at the members’ meeting from memory, where everyone recalls their own version of how the range performed.
Working together
Start with a proof of concept. Decide the rest afterwards.
Nobody starts by measuring every product in every store. The scope grows in three steps, and the first one is small on purpose.
Proof of concept
A sample of stores, one category
You name the stores and the category. We measure them, you read the result on your own shelves, and you decide whether the number tells you something you did not already know.
First deployment
More stores, more categories
The usual next step is the categories that carry the largest supplier budgets, because that is where a week out of line costs the most and where a supplier is most likely to ask what they paid for.
Full roll-out
The whole estate, the whole standard
Every store, and every category where the shelf standard is worth money, read on the same three numbers, so one store can be compared with the next.
Products enter the recognition models category by category as the scope grows, so your operations team sees results while the range is still being extended.
In our own FMCG manufacturer deployments availability KPIs improved by up to 20% once the data started coming back regularly. How much you get depends on what you do with the findings.
See it on your own shelves
Tell us which categories and store formats you work with, and we will walk you through exactly what a check returns and how it would read your shelves.
Book a live demo