





On-trade data
How many venues do you really sell to?
When I talk to on-trade sales managers, the conversation almost always starts with files. Distributor sell-out data (secondary sales) comes in from dozens of wholesalers and distributors at irregular intervals. Some send a PDF once a month, others a spreadsheet every week, and almost every one of them has its own columns and its own product names. Before you can read anything from it, someone has to copy it into a common spreadsheet. Nobody sees volume and distributor stock side by side. Finding out which venues you sell to takes three steps: bring the data into one format, merge customers served by several wholesalers, and work out which customers are bars and restaurants (HoReCa).
The question is getting more urgent because people are drinking less alcohol and drinks menus carry more alcohol-free (0.0%) versions. That decline isn’t spread evenly across venues, and a manufacturer wants to know in which venues its own sales are getting weaker.
What you cannot see in wholesaler sales data
A market report can show that on-trade alcohol sales in your country are falling. It won’t show in which venues, or whether your brand is affected. You only see that in data from wholesalers, because it describes each customer separately: what they ordered, how much and when.
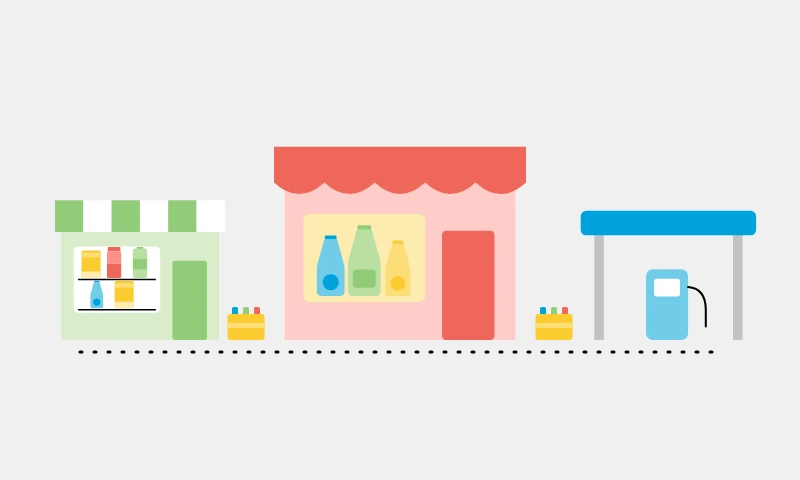
The difficulty is that this data doesn’t say which customer is an on-trade venue. A small bar that buys your products through a wholesaler looks exactly like a neighbourhood shop or a petrol station: a customer number, a tax number and a list of orders.
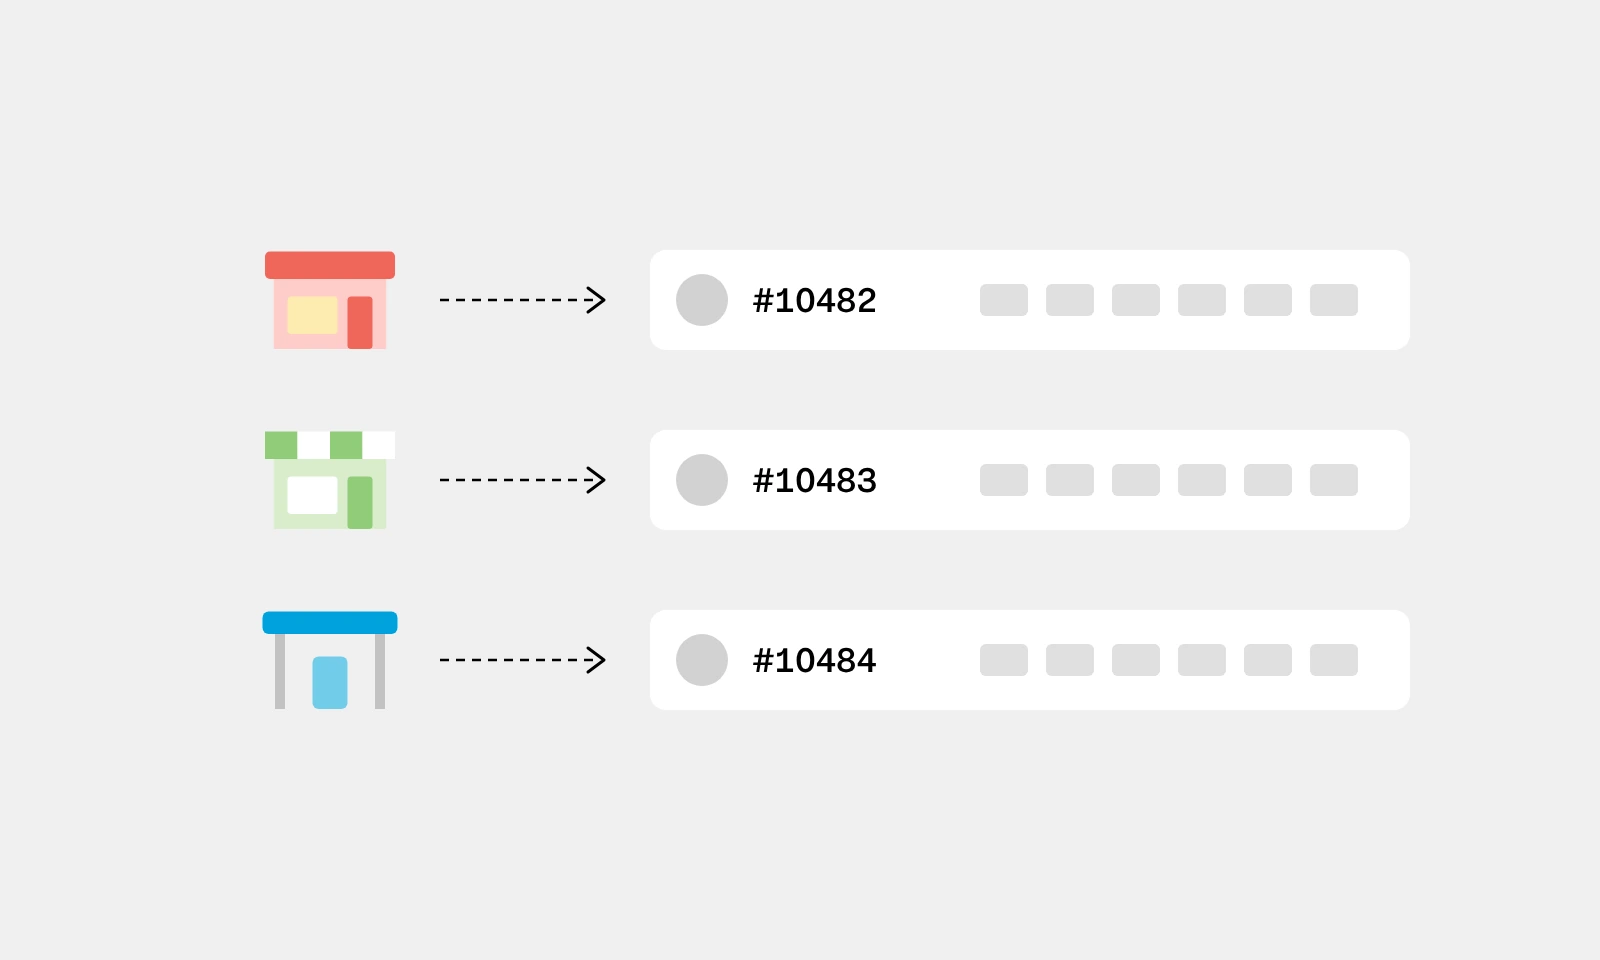
You know the channel only for the venues your sales rep visits. Those are in your own field sales system, tagged by channel: shop, petrol station or on-trade. In my experience, a large share of the venues your products reach through wholesale have never had a visit from anyone at the manufacturer. What you know about them is what the wholesaler data contains.
There are a lot of these venues. According to an estimate by Statistics Poland (GUS), Poland had 101,500 food-service outlets in 2024, permanent and seasonal. In chain retail, a handful of head offices make the decisions for thousands of stores. In the on-trade I see something different: the owner of each venue decides what goes behind the bar. So you need to see every venue in the data individually.
How we organise wholesaler data
Trade Data Hub brings data from wholesalers and distributors into one place and one format, with volume and the stock each distributor holds. It works with more than 1,600 distributors in 27 markets.
Next, we merge customers so that a venue is one customer in the data, however many wholesalers serve it. Otherwise a restaurant that buys from two wholesalers is counted twice, and a change of supplier looks like a lost customer.
We assign the channel from business activity codes, alcohol licence registers, company registers and public information about the venue. Every assignment gets a confidence score. At a large alcohol and food manufacturer, this is in everyday use: on-trade venues identified in wholesaler data, each with a confidence score.
The rep who knows the venue checks assignments with low confidence. The manufacturer can also decide that the rep’s classification takes priority over the automatic one.
What you see once you know which customer is a venue
The simplest thing is the number of venues: how many of them buy your products, where orders are growing and which venues have stopped ordering. For venues that nobody from your team visits, treat that result as a signal and check it on site. If venues in one area are taking fewer alcoholic products and more alcohol-free versions, you can see which venues they are. Add the list of your contracts with venues, and you can also check whether a contracted venue buys more than a comparable venue without a contract.
A category gap is harder to measure. That’s my name for a venue that buys a lot in a category and little of it from you. It needs a different conversation from a venue where the whole category hardly sells, whether that’s beer, wine or spirits. When every wholesaler supplying the venue shares data on purchases across the whole category, competitor brands included, you can see your brand’s share of those purchases. Trade Data Hub gives you that measurement. When only some of the venue’s wholesalers share data, a “small share” may only mean that the venue buys the rest somewhere else.
Estimating potential and B2B customer segmentation
When full data is missing, you’re left with an estimate. Estimating potential and choosing which venues to visit is B2B customer segmentation. We do this with Route-to-Market Optimization, which alcohol manufacturers already use in the on-trade. The basis is distributor sell-out data, meaning what a venue buys from its wholesalers. On top of that come qualitative questions the rep answers while segmenting venues: what the back bar looks like, the lighting and the interior, what’s on the menu, and what the relationship with the owner and staff is like. None of this is in the wholesaler data, and it largely decides which segment a venue ends up in. For a venue that nobody visits, this part is missing. The estimate then rests on the data and on public information about the venue, so it stays rough until a rep goes there.
An estimate only makes sense when you compare a venue with others of the same type, with a similar size and number of seats, a similar price level and similar opening hours. The surroundings matter too. In the centre of a large city, venues from a few neighbouring streets are enough. In a small town you need a wider area, because there are fewer similar venues.
A white space analysis of five city-centre restaurants
This example is based on what we see in projects with alcohol manufacturers. The venues are simplified and anonymised.
Five restaurants operate in the same area, with similar prices and opening hours. They differ in size and number of seats. All of them buy your products through wholesalers. Your rep visits the first three, and nobody visits the fourth or the fifth. The fifth has only been in the wholesaler data for a few months. The wholesalers in this area don’t share data on purchases across the whole category, so you can’t measure your share directly, and the potential of each restaurant has to be estimated.
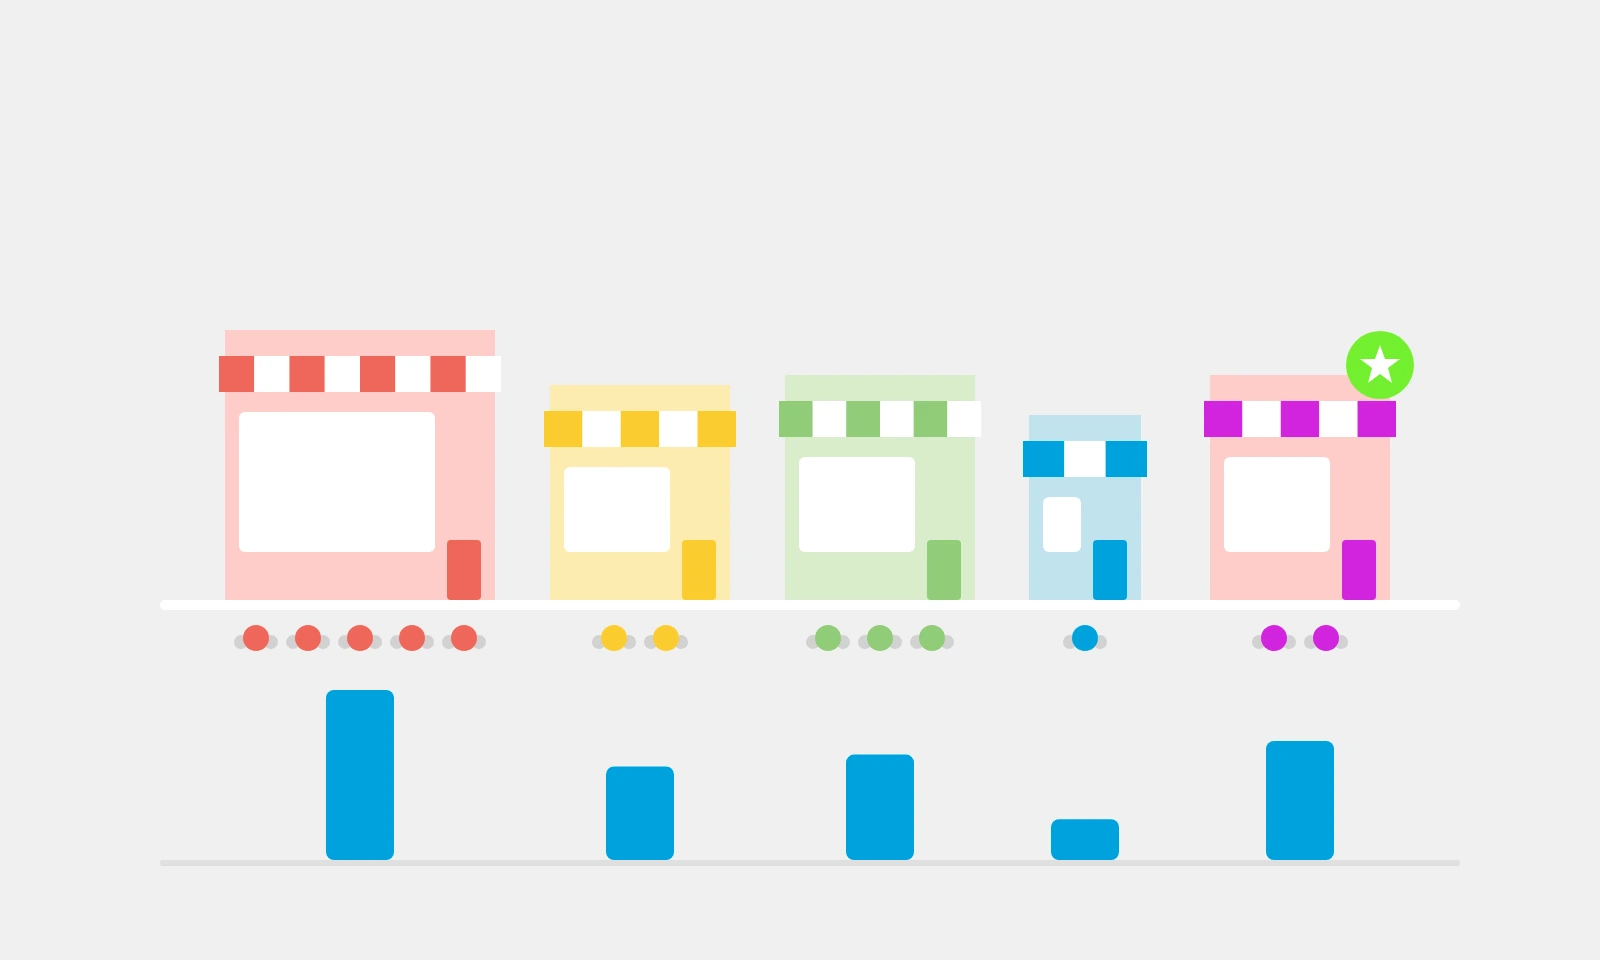
The first two buy roughly what their size and profile suggest. The rep keeps visiting them at the same frequency as before.
The third has the most seats of the five, yet it buys clearly less than the first two. On the next visit the rep’s task is to find out where the difference comes from and whether the gap can be closed.
The fourth buys little, but it’s a small place with a few tables and its estimated potential is low as well. Visits there wouldn’t pay for themselves, and orders can keep going through the wholesaler.
For several months the fifth has been ordering more and more of your products, and in size and profile it resembles the first two. Nobody from your team has visited it yet, so it goes on the list for first visits.
What this data will not tell you
Wholesaler data describes deliveries to a venue. It contains neither sales to guests nor the prices on the drinks menu. It covers only the wholesalers that share data, so a venue that “stopped ordering” may have moved to a supplier that doesn’t share it. Some venues are also tied to a competitor through an exclusive deal. If such a venue has high potential, you can only win it once the deal ends. Three of these gaps can be closed during the rep’s visit. A photo of the drinks menu, read by Menu Recognition, shows whether your brand is on the menu and at what price. A change of supplier or an exclusive deal with a competitor the rep hears from the owner and records in the field sales system. Sales to guests stay out of reach of both.
Three questions to start with
- How many on-trade venues buy your products?
- In which of these venues are your sales lower than their potential allows?
- Which venues served only through wholesalers are worth sending a rep to?
I’d start with the first question, because the other two depend on it. Once you count venues, you’ll find some that appear in wholesaler data but not in your field sales system. The number of venues comes from the organised wholesaler data in Trade Data Hub, and the category share comes from there too, wherever wholesalers share data on the whole category. For the other venues, segmentation shows the difference between what they buy and their estimated potential. If your products reach the on-trade through wholesalers and distributors, get in touch. We’ll use your own data to show how many on-trade venues already buy them.

Andrzej Masłowski
Deputy Director of Sales and Implementations
Asseco Business Solutions
Andrzej runs sales and delivery for Trade Data Hub and Trade Terms & Settlement. Working out which wholesaler customers are bars and restaurants, and which of them are worth a rep’s visit, is the layer he works in: wholesaler data, venue identification and segmentation for on-trade teams.
If you are counting your on-trade venues, or deciding which of them deserve a visit, that is the conversation to have.
Frequently asked questions
How can I tell which wholesaler customers are bars and restaurants?
By assigning a channel to every customer in the wholesaler data, using business activity codes, alcohol licence registers, company registers and public information about the venue. Each assignment gets a confidence score, and a rep who knows the venue can correct it. That assignment is what turns a list of customer numbers into a count of on-trade venues.
What is white space analysis in the on-trade?
It is a way of finding where your sales could grow: venues that buy less than comparable venues, and venues that buy through wholesalers but that nobody from your team visits. Where wholesalers share data on the whole category, the gap can be measured. Elsewhere it is estimated from distributor sell-out data and the rep’s qualitative assessment of the venue.
What can wholesaler data not tell you about an on-trade venue?
It shows deliveries to the venue, not sales to guests or the prices on the menu. It covers only the wholesalers that share data, so a drop in orders may mean the venue moved to another supplier. It also cannot show exclusive deals with competitors; the rep learns about those from the owner.
Count the on-trade venues that already buy your products
We’ll take your wholesaler data and show how many bars and restaurants buy your products today, and which of them nobody from your team visits.