





Before the first report exists: how we build the reporting layer of a large rollout
The reporting layer is every report a client gets out of the system. Building it for a large retail execution rollout, meaning the daily work of field reps in stores, is not a matter of drawing a handful of charts.
Three things have to meet before the first report exists
What the client wants, what the app can actually collect, and whether the system can process it and send it on time. Here is how we do it, on a project for a global beverage manufacturer in the US market, where Daniel Janik from our team leads the reporting layer.
Five stages, two of them checks against reality
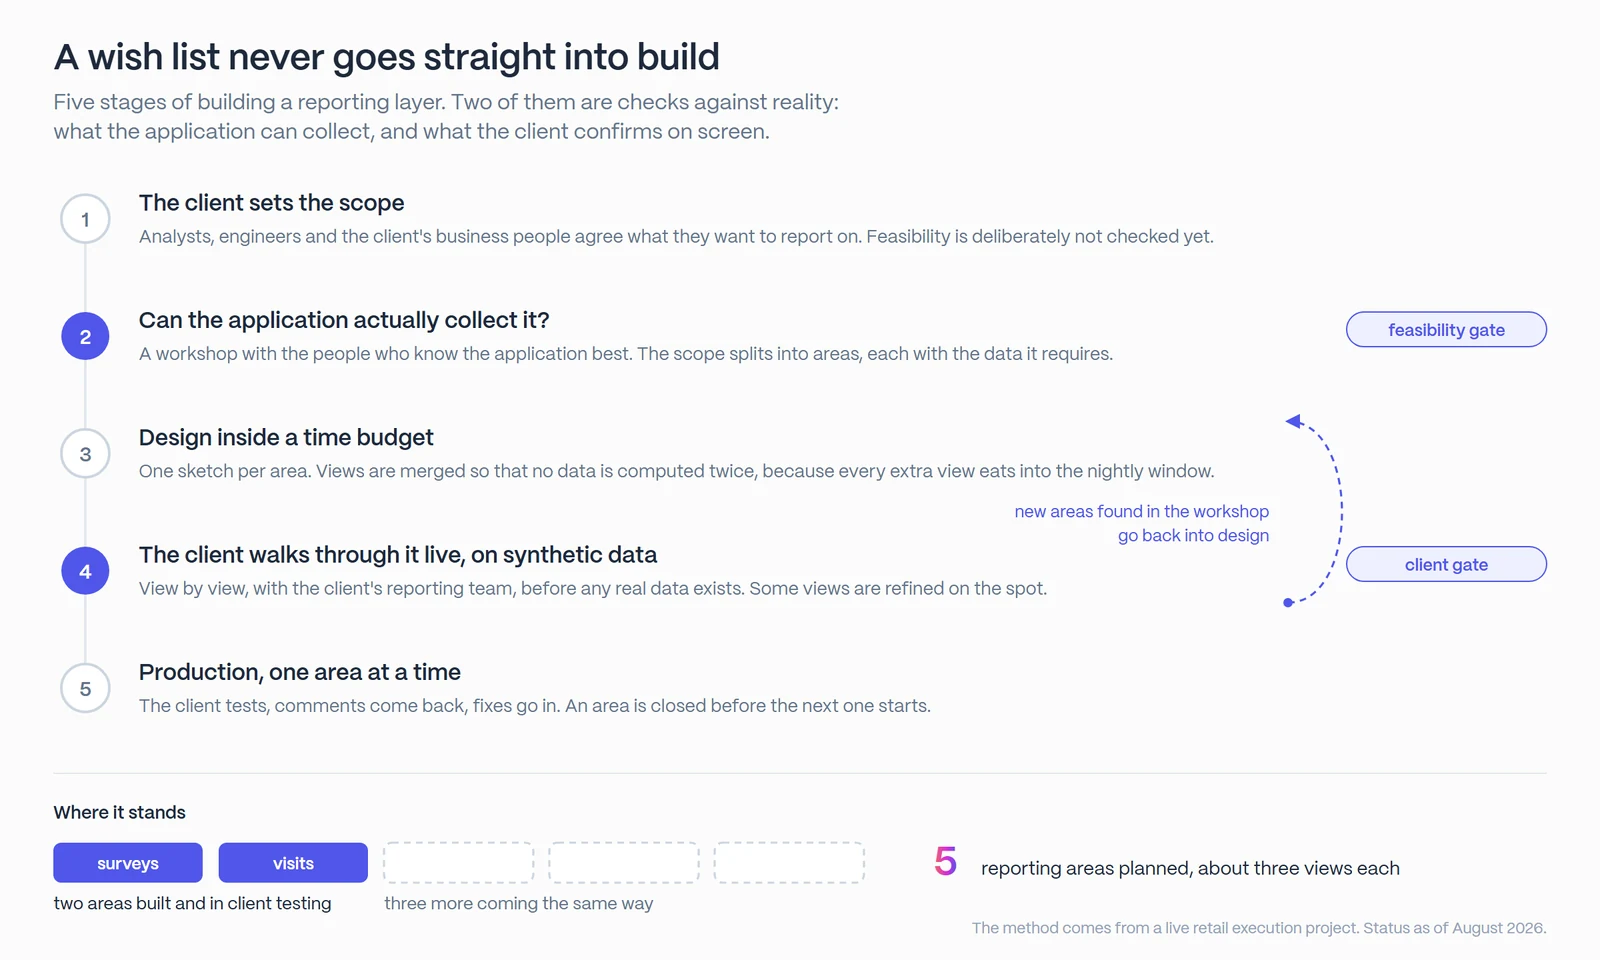
A wish list never goes straight into build. It passes two checkpoints first: whether the application can collect the data at all, and whether the client confirms the reports on screen.
1. Scope starts with the client, but a wish list is only the beginning
First the analytical and technical teams sit down with the client’s business people and agree what they want to report on. We deliberately don’t check that list yet against what can actually be collected: that comes in the next step. Reports built against wishes nobody has verified fall apart the first time they meet real data.
2. Can the application actually collect it?
Then we put those requirements up against what the application can do. At a workshop in Canada, the client’s team was joined by the people who know the application best and know what data it can realistically collect. That is where the client’s list of needs meets the capabilities of the system. The result: the whole scope split into concrete areas, for example how reps’ visits are carried out or how promotions are executed, each with the data it requires. Only requirements confirmed this way go to our reporting team.
3. We design lean, because performance is a constraint from the first sketch
Each area gets an initial sketch: what it should show and how. We combine the individual views, meaning the single tables and summaries within an area, so that the same data is not repeated or multiplied beyond need. With a very large number of users, a full day of data has to be processed and sent within a narrow time window, so that the client gets the complete set of reports on time, every day. Every unnecessary view stretches that processing and eats into the window.
4. We check the finished design with the client live, on synthetic data
We presented the sketch at a workshop in Salzburg. We built it on synthetic data to show how the reports work and what they show, before any real data came in. Together with the client’s reporting team we went through all of it, view by view. Some solutions we refined on the spot, and along the way further areas worth reporting on came up. We sketched them out right there, together.
A well-prepared demo generates new ideas on its own. The client sees a finished view and says straight away: we want to measure that too.
Daniel Janik

5. Production, one area at a time
Today we are in production. There will eventually be five reporting areas, including the ones discovered in Salzburg, with an average of three views each. Two are already built and being tested on the client’s side: one covers surveys and the data reps collect, the other shows whether and how planned visits were carried out. After testing the client raises comments, we apply the fixes. That is how we close each area before moving to the next.
Wondering where reporting like this sits in the product? The analytics layer of Sales & Retail Execution is called OneView.


Daniel Janik
Project Manager, Asseco Platform
Leads the reporting area on a retail execution project for the US market. LinkedIn